Captures and impressions of the surroundings of Santa Barbara, California. An Augmented Reality installation created during an artist residency at NCEAS.
Processes to create high-detailed models of insects. A 3D scanner and the outcomes as art and science.
See through the eyes of butterflies and fall in love with biodiversity. VR installation with high-res print, soundscape and huge butterfly egg.
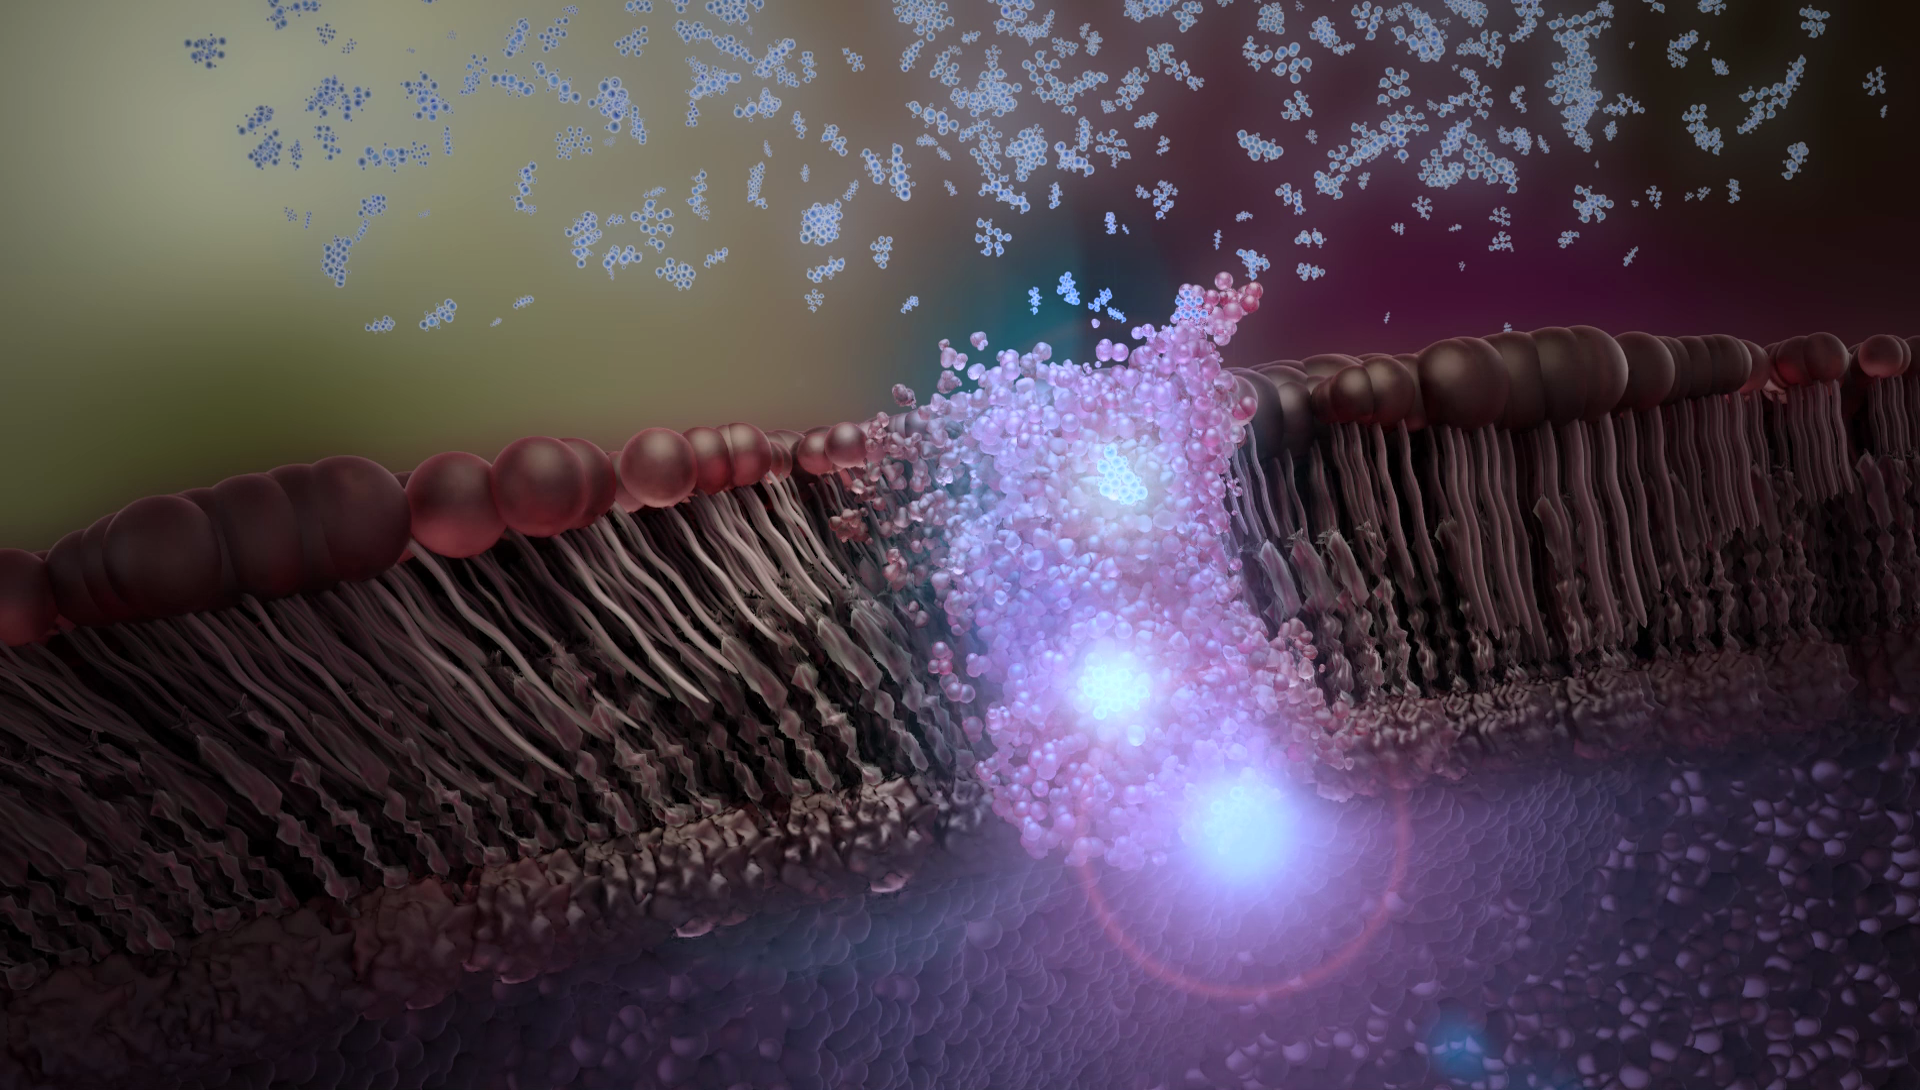
Learn about the "Action in the Nucleus" which is one possible process to edit genes.
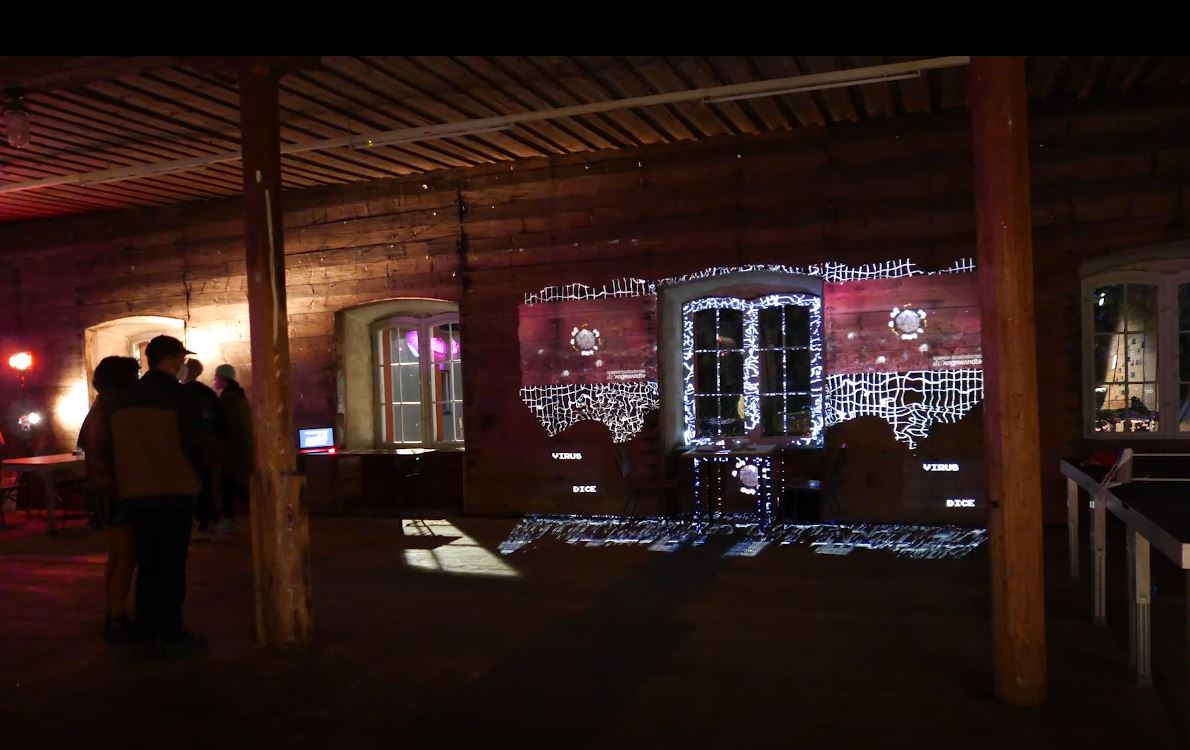
Life and death. SARS-CoV-2 and the chance of staying healthy. Performative dice game and projection mapping of computer animation.
Is collaboration everything? How to we go beyond the limits of contemporary scientific imaging? Installative sound-driven data visualization.
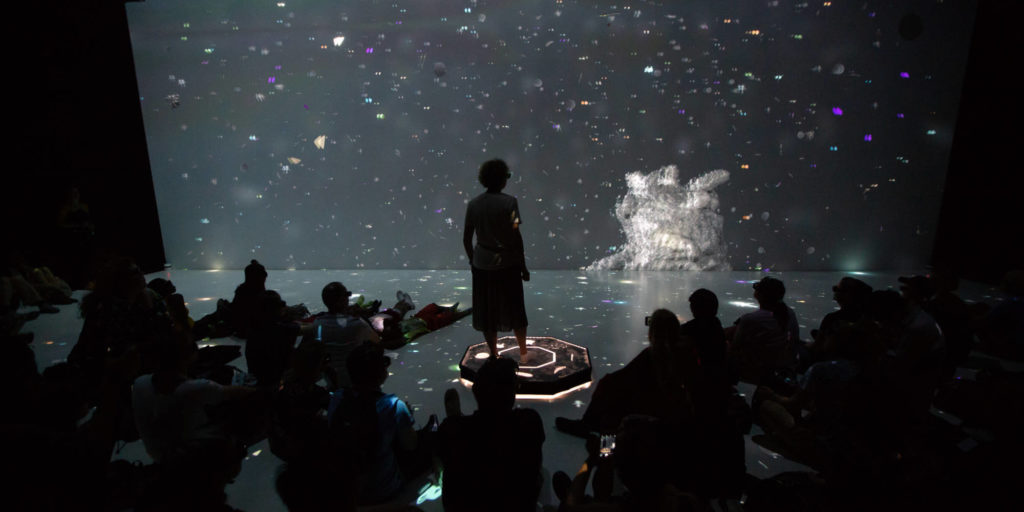
Deep Space experience in collaboration with Postl Film and Media BOKU (University of Natural Resources and Life Sciences Vienna).
See how the human brain gets energy for thoughts. Glucose is the key to keep the brain functioning.
Media art installation experiences with large projections, AR and VR of plankton in noise pollution in collaboration with Victoria Vesna, professor and head of the Art|Sci Center at UCLA.
Climate and art – touching and being touched by art interventions in the context of climate change.
Transformation and social paradigm shift are influenced by art and culture.
Dive into the world of plankton. Watch the stereoscopic documentary to see what is threatening to plankton, the ocean and therefore also for humanity.
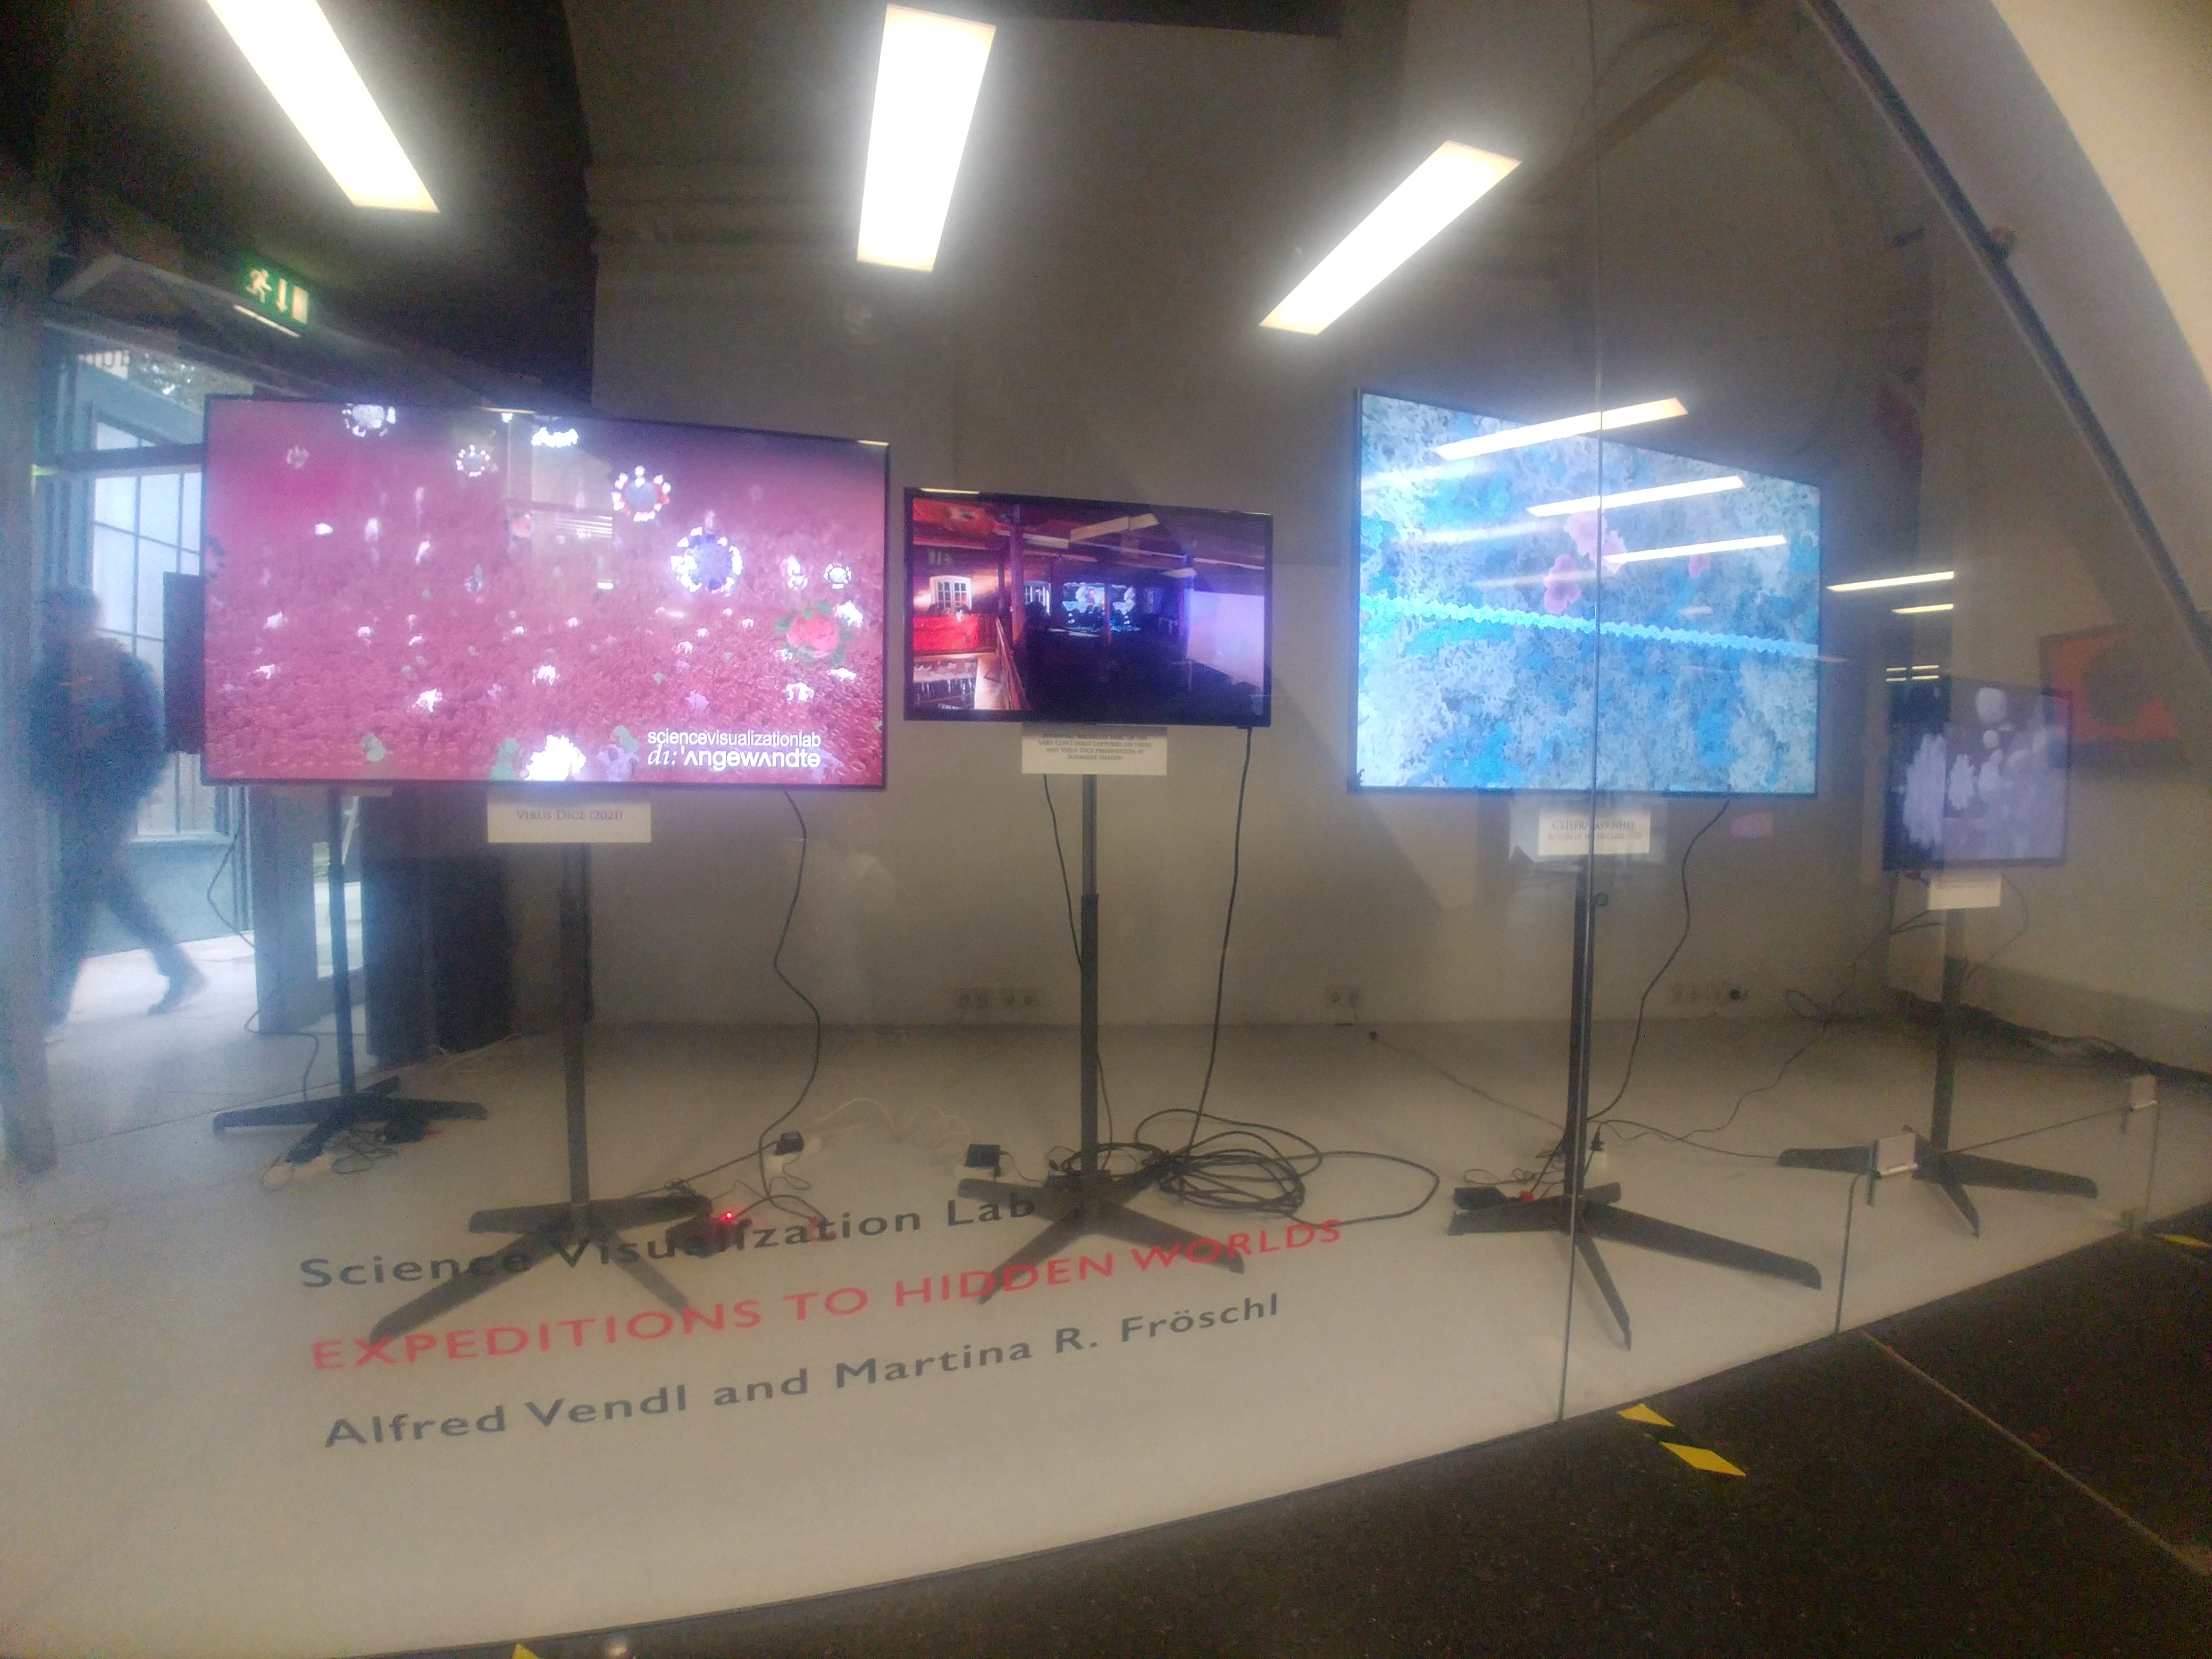
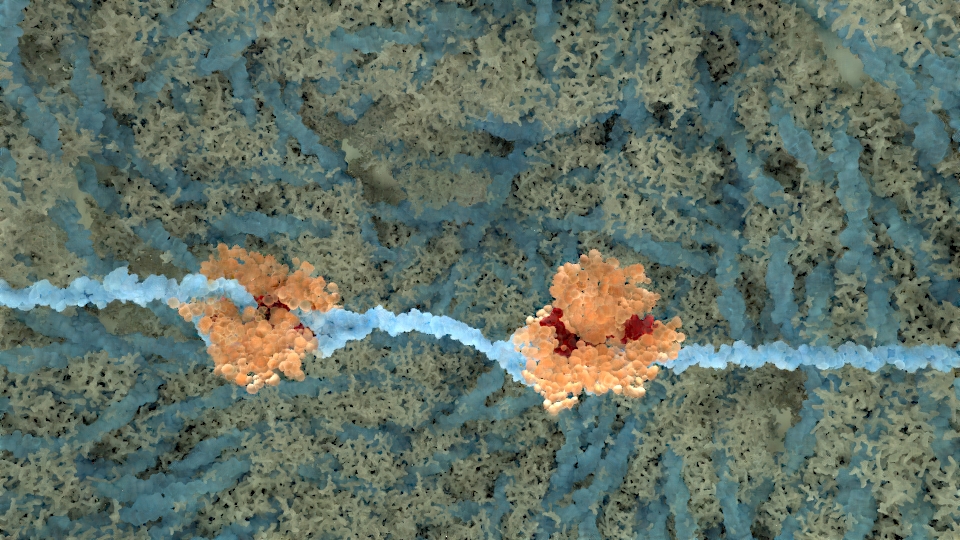
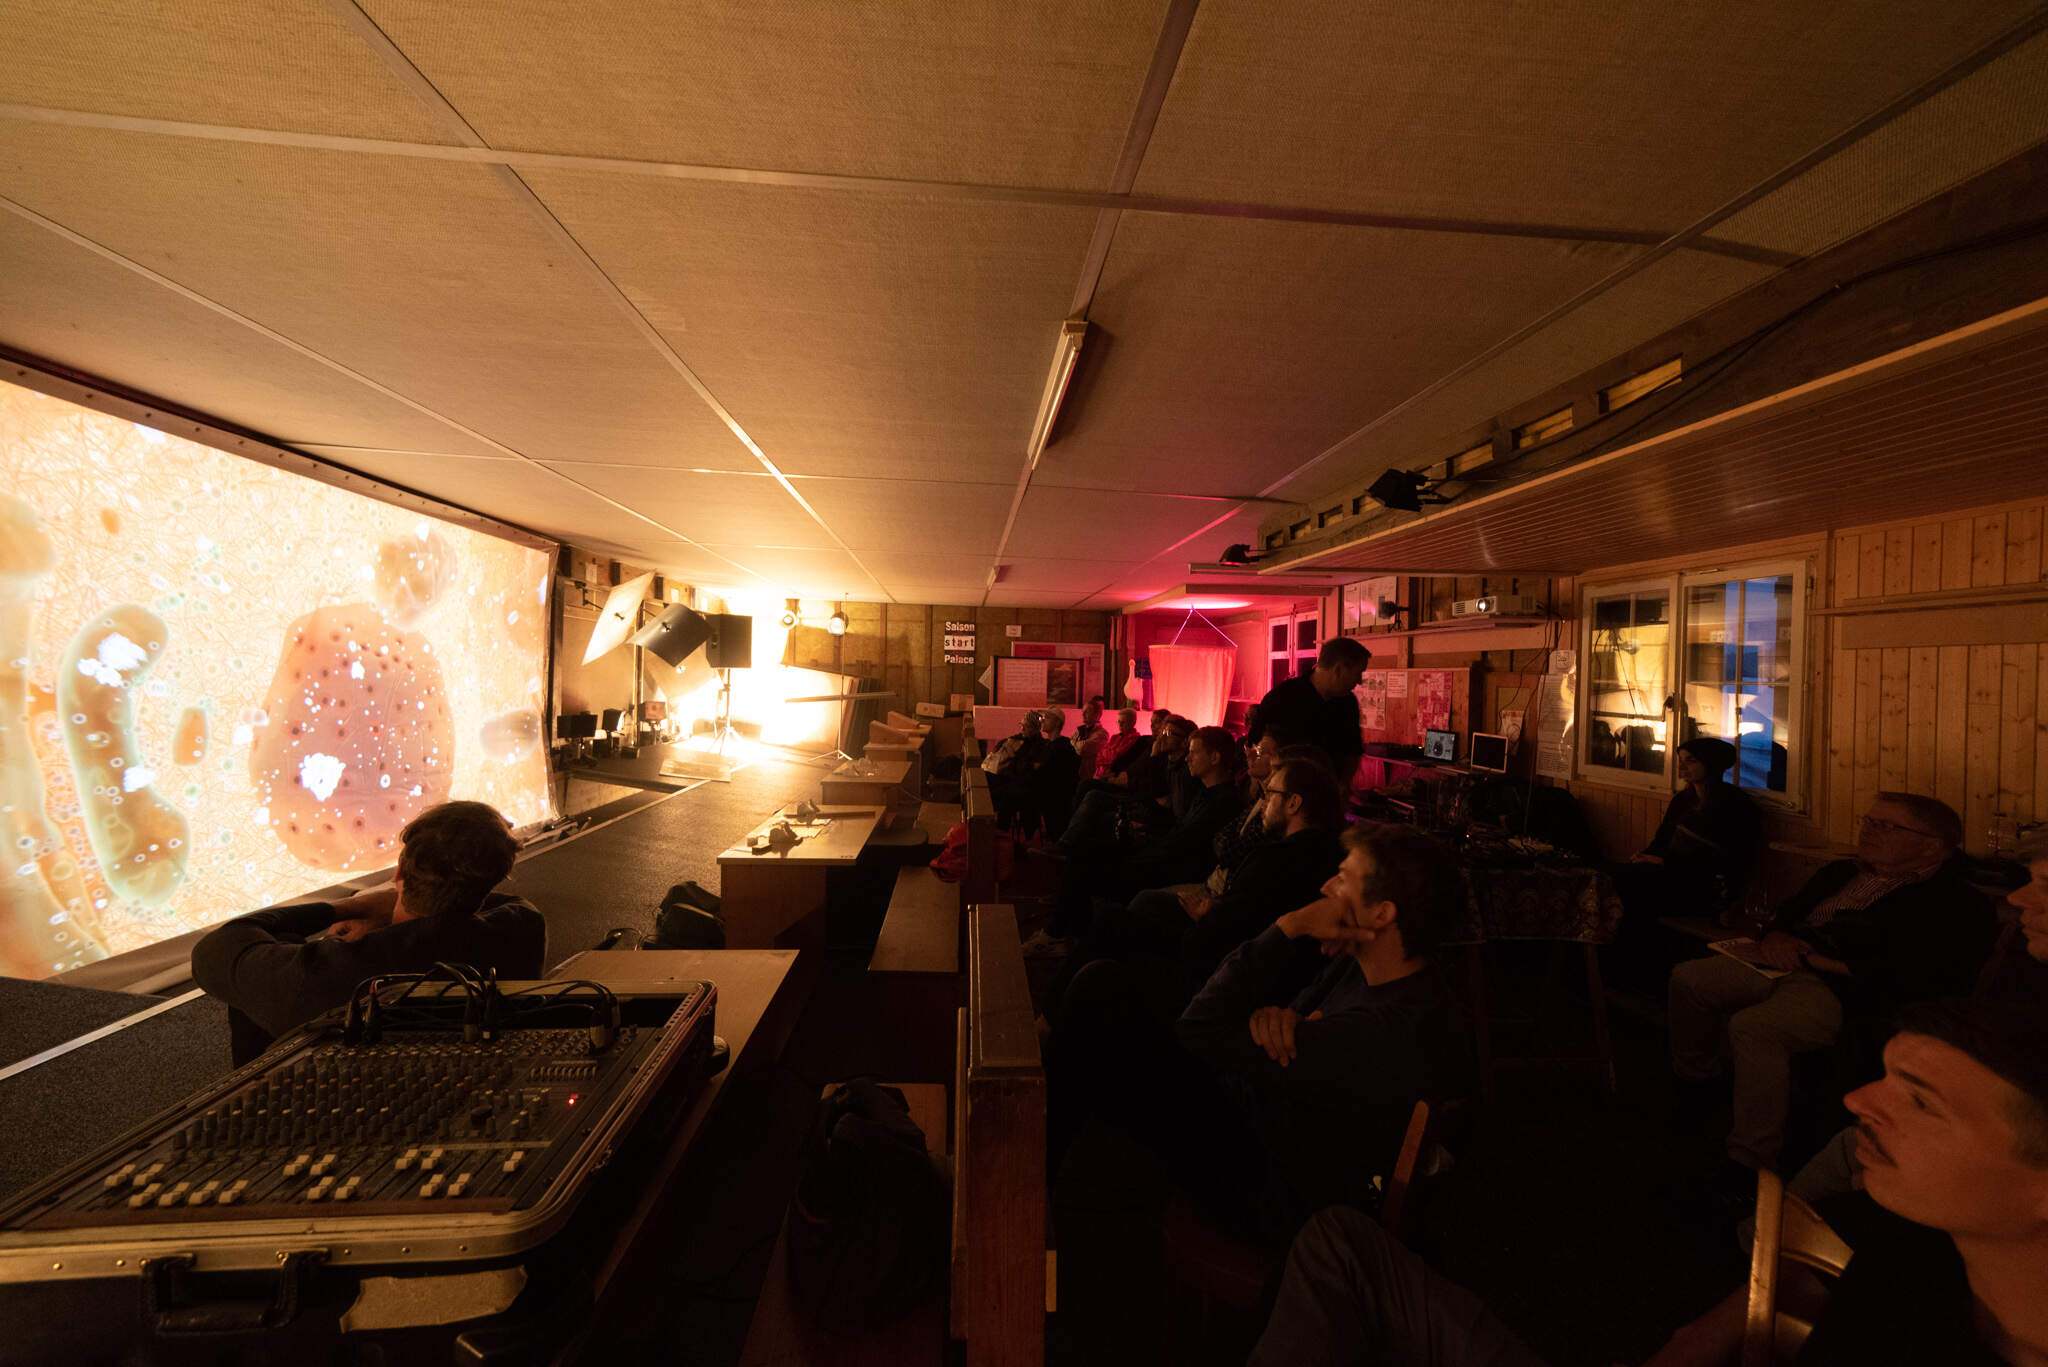
The common understanding of modern scientific research becomes more and more difficult as activities are carried out in size and time ranges we cannot perceive with the unaided eye. The key to understanding is often a visualization of these hidden processes. The Science Visualization Lab at the University of Applied Arts in Vienna, Austria, specializes in making invisible scientific phenomena visible and disseminating this visual information in research and artistic exhibitions. The primary objectives of the lab are keeping the authenticity of the scientific data used, while also crafting captivating and imaginative artistic expressions.
© Science Visualization Lab of the University of Applied Arts Vienna, Georg-Coch-Platz 2, Room 111, 1010 Vienna